linear.app
Dashboards – Linear Docs
Dashboards let you bring together insights from across teams and projects onto a single page.
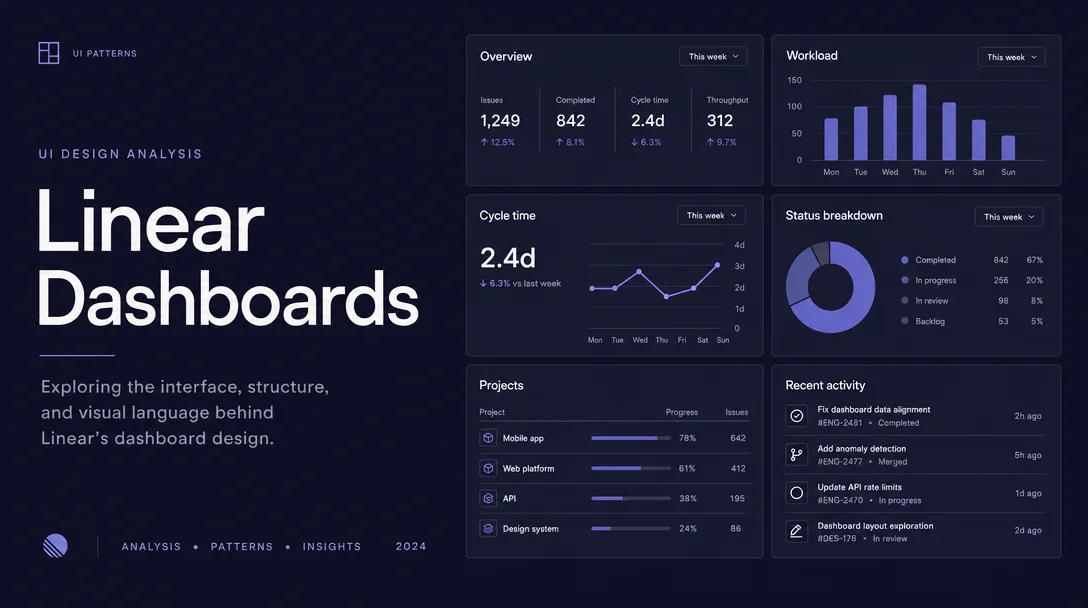
A teardown of Linear's new Dashboards canvas: the three-tier module system, the no-chrome whitespace contract, a two-layer filter state model, and the inline drilldown micro-interaction that eliminates context loss.

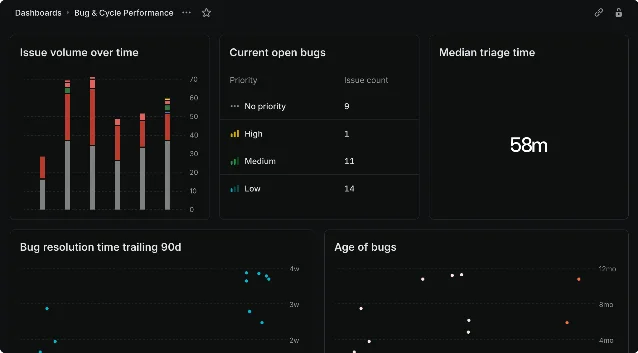
| Format | What it answers | Scan time |
|---|---|---|
| Metric card | Is this number good or bad right now? | < 1 second |
| Chart | Is the trend moving in the right direction? | 3–5 seconds |
| Table | Which specific team / person / label is the outlier? | 10–30 seconds |
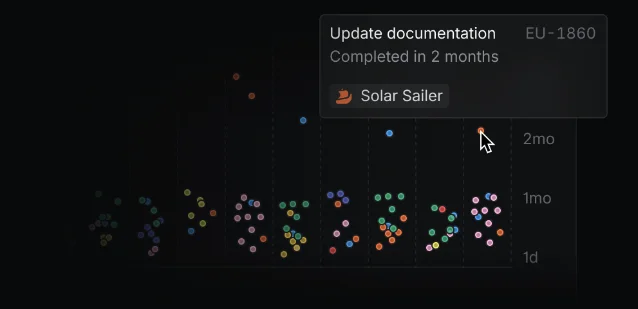
EU-1860), semibold issue title, regular project name. Three information tiers in ~60px of vertical space. That consistency isn't accidental; it means any Linear user already knows how to read a Dashboards tooltip the first time they see one.Dashboards let you bring together insights from across teams and projects onto a single page.
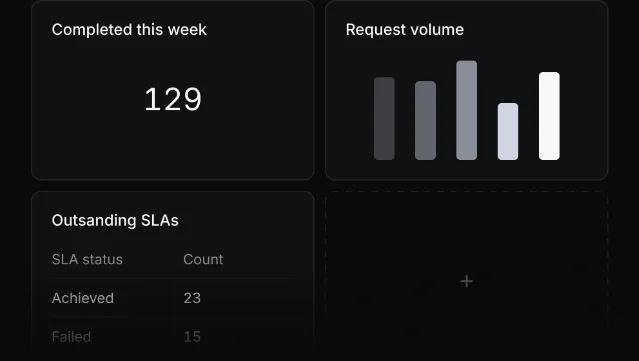
Add more perspectives or context around this Drop.